

There is a conversation that repeats itself in almost every farm I have visited, regardless of whether it is coffee, milk, avocado, or beef cattle. I ask the producer how much it costs to produce a unit of their product, a kilogram of dry parchment coffee, a liter of milk, a kilogram of live weight meat, and the answer almost always comes with an awkward silence, followed by a quick estimate and a smile that says "more or less, around there." The curious thing is that the same producer knows perfectly how much a bag of fertilizer costs, how many daily wages they paid last week, and how many bales of hay their herd consumed the previous month. They have all the data. What they lack is a system that organizes them to answer the only question that matters: is this business profitable or not?
The problem is structural. According to the national coffee production cost study conducted by Agronomist Jackeline Londoño, based on a sample of 2,784 coffee farms from 11 departments, and according to the comparable analysis of 2020 on 1,806 farms, 64% of producing families do not reach a living income, meaning they do not achieve a minimum level of dignified income from their farm. The main reason is not always the price of coffee or the weather: it is the lack of control and analysis of production costs that allows them to make timely decisions.
In livestock, the scenario is not very different. The Colombian Federation of Cattlemen (FEDEGÁN) has documented that labor and feed inputs account for approximately two-thirds of the total cost of milk production in Colombia, and that with the constant fluctuation of input and sale prices, entering negative profitability is frequent and common, particularly when the producer does not have a clear cost control system that allows them to adjust in time.
This blog is not an accounting class; it is a technical guide to understand what you should measure, how to organize it, and how to use it to make decisions that improve the real profitability of your production system. Let's go step by step.

Fixed costs, variable costs, and indirect costs: the order that defines everything
Before talking about profitability, costs need to be organized. And this is where many farms get lost because they mix everything into one bag and in the end, they don't know what is really hurting them in the operation.
Fixed costs are those you have to pay regardless of how much you produce. If your farm produces 100 loads of coffee or 10 loads in a season, these costs are still there. This category includes rent or the opportunity cost of land, permanent labor, depreciation of infrastructure and equipment, property taxes, agricultural insurance, and administrative fees if any. Their key characteristic is that they are spread across total production: the more you produce, the less each of them weighs per unit sold.
Variable costs are those that change directly with the volume of production. If you produce more, you spend more. This includes fertilizers, agrochemicals, nutritional supplements, harvest wages, energy for milking, fuels, transportation of milk to the collection center, and packaging. These are the costs that the producer identifies most easily because they see them leaving their pocket every week.
Indirect costs are those that do not relate directly to production but to the general operation of the farm: external technical assistance, accounting, public services in the urban area, communications, administrative expenses. In many small farms, these costs are underestimated or ignored, but when summed up over the year, they can represent between 5% and 12% of the total cost.
The distinction between these three categories is not just conceptual. It allows you to later calculate the break-even point, the contribution margin, and the real profitability per unit produced. Without that separation, any financial analysis is incomplete.
Practical example: a coffee farm of 4 hectares
Let's take a real case adjusted to the average conditions of the Coffee Axis, according to consolidated cost studies: A 4-hectare farm in production, with an average productivity of 145 arrobas per hectare (a figure close to the national average documented in the 2020 coffee cost study), producing dry parchment coffee.
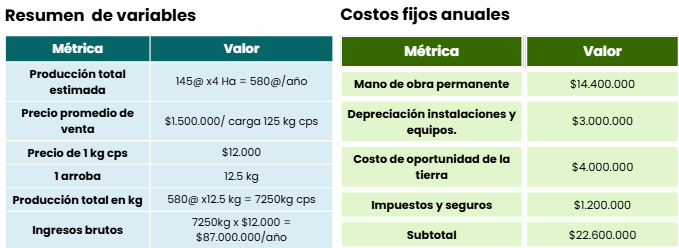
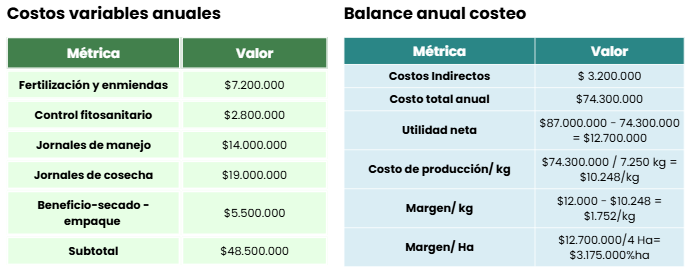
This is exactly what the producer almost never calculates. And this number, the cost per kilogram produced, is the indicator that will practically define all strategic decisions: whether it is worth renewing lots, whether it is advisable to seek differentiated sales channels, whether the fertilization plan is optimized, or whether productivity per hectare is the bottleneck.
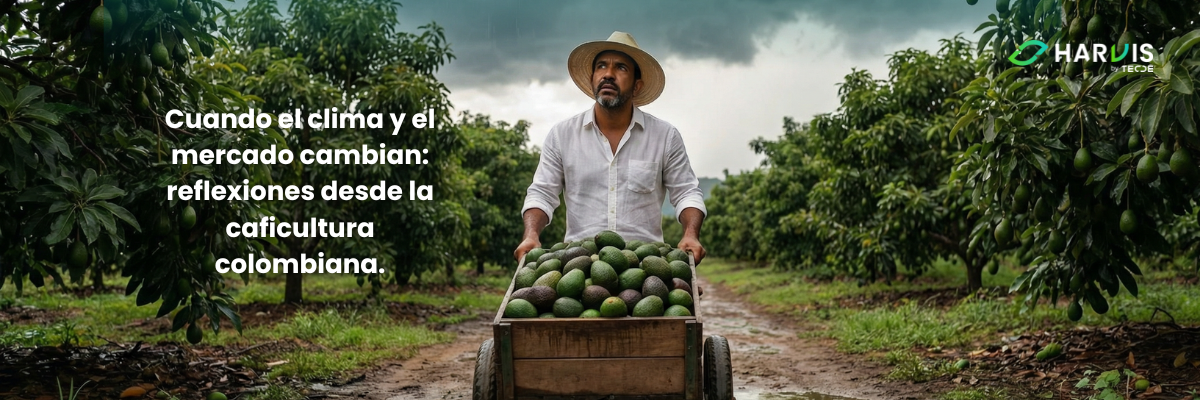
The national coffee cost study found a range of costs per kilogram between $2,363 and $4,337 in 2022, depending on the technological level, the area, and the productivity of each farm. That difference of up to 84% between similar farms is not explained by luck: it is explained by management. When farms are segmented by profit margin per hectare, the most determining differentiating factor is productivity, followed by efficiency in the use of inputs. As we addressed in our blog When climate and market change: reflections from Colombian coffee farming, which you can read by clicking on the following image, today's coffee grower faces dual pressure: uncoordinated flowering due to climate and international prices on a roller coaster. In that scenario, knowing your costs in detail stops being a good administrative practice and becomes a condition for survival.
Practical example: a dairy farm with 25 milking cows
Now let's move to a livestock system, where the cost dynamics change significantly due to the presence of animal inventory and continuous consumption of inputs. Let's take a dual-purpose farm with 25 milking cows, adjusted to parameters documented in the Agro-Economic Reference Framework of Finagro for dairy farming and the cost sheets of Valle del Cauca published by UPRA.
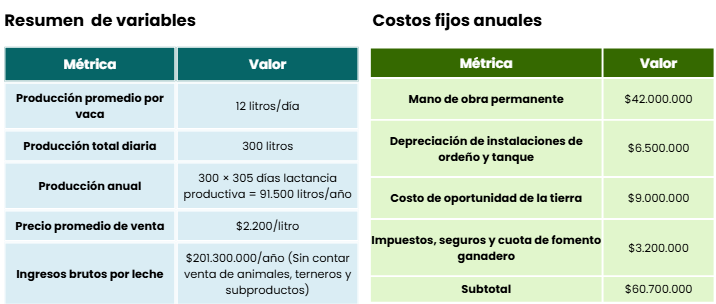
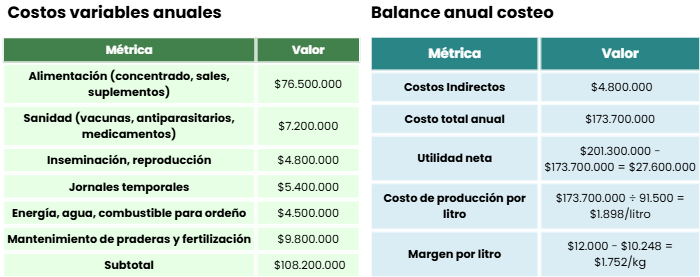
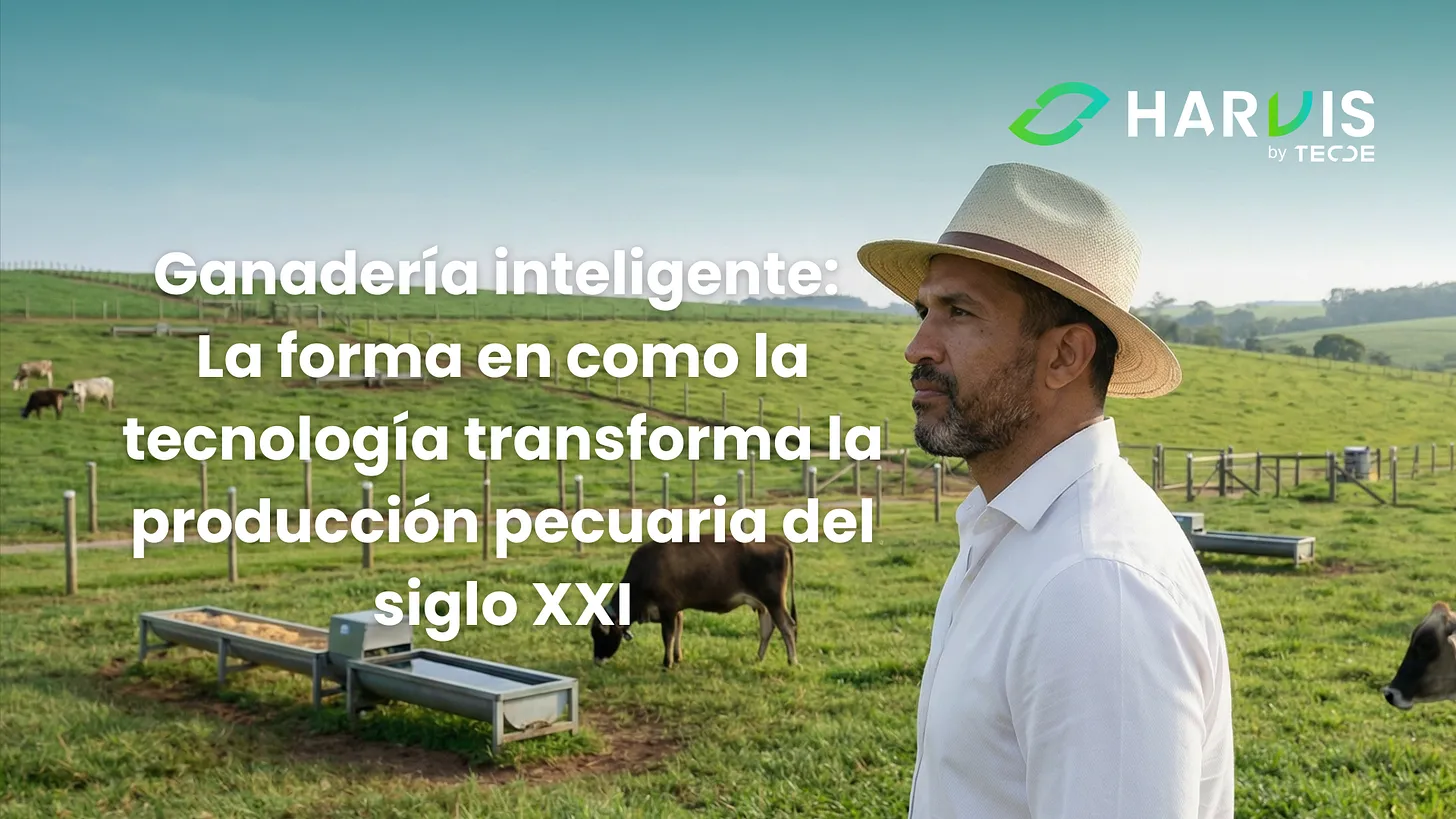
These data coincide with what FEDEGÁN has documented in its analysis of milk production costs in Colombia: narrow margins, great sensitivity to fluctuations in concentrate prices and the price paid by the industry. A 10% variation in the cost of concentrate can eat up almost half of the margin per liter on a typical farm. As we explained in our blog Smart Livestock: how technology transforms livestock production, in tight margin scenarios like that of Colombian dairy farming, what is not measured per animal and per input simply cannot be adjusted in time; you can read the blog by clicking on the following image.
The real cost is not the invoice: how inventory management can make you lose up to 10% without realizing it.
Here comes a topic that most livestock producers underestimate and that directly affects the cost per liter or per kilogram produced: inventory turnover. In livestock systems, the farm operates with two types of inventory that move constantly: consumable inputs (concentrates, mineral salts, medications, vaccines, supplements) and, in some cases, animal inventory.
The FIFO method (First In, First Out) is a control system where the first inputs that enter the inventory are the first to be consumed or sold. It is not abstract accounting theory; it determines whether the cost that appears in your spreadsheet matches the real operating cost, or if there is a silent leak that is robbing you of margin without appearing on any invoice.
A concrete case: a dairy farm buys 100 bags of concentrate in January at $85,000 each, and 100 more bags in April at $98,000 each due to the rise in raw materials. If the milker takes bags from the deposit without order, taking the newest ones because they are more accessible, the January bags remain at the back. When they remember them, they have already been stored for three months, with a high probability of moisture, contamination with pests, or loss of nutritional properties. $8,500,000 that can become a total loss, without appearing as such in any record: they simply "spoiled." The same happens with veterinary products, aggravated by expiration dates, which is especially sensitive when we talk about antibiotics whose traceability is critical for the safety of milk.
Additionally, in conditions of input inflation —like those experienced by Colombian agriculture in recent years— the FIFO method has a concrete accounting effect: since the oldest inputs (purchased at a lower price) are recorded as the cost of sale first, the reported production cost reflects the real historical cost of the operation, avoiding distortions that can make a system appear profitable that is no longer so. This matters when the farm needs reliable financial statements to access agricultural credits or demonstrate viability to business partners.
In practice, applying FIFO on a livestock farm does not require complex software: it requires labeling the entry date on each batch of input, organizing the deposit so that the oldest is at the front, and recording the exits in the correct order. Farms that do this systematically reduce losses due to expiration, deterioration, and waste in a measurable way, improving the real cost per unit produced without touching a single technical parameter.
The break-even analysis: the figure that defines whether your farm is viable
The break-even point is the level of production at which total revenues equal total costs. You neither gain nor lose. It is the minimum activity threshold that your farm must reach to avoid operating at a loss. Knowing this point radically changes the way investment, management, and marketing decisions are made. The formula is straightforward:
Break-even Point (units) = Fixed Costs ÷ (Unit Selling Price - Variable Unit Cost)The difference between the selling price and the variable unit cost is called the contribution margin: it is what each unit sold contributes to covering fixed costs and, once covered, generating profit.Applying it to the coffee farm in the example:
- Annual fixed costs: $22,600,000
- Indirect costs: $3,200,000 (we add them to the fixed for analysis)
- Total fixed: $25,800,000
- Price per kg: $12,000
- Variable cost per kg: $48,500,000 ÷ 7,250 kg = $6,690/kg
- Contribution margin per kg: $12,000 - $6,690 = $5,310/kg
Break-even point = $25,800,000 ÷ $5,310 = 4,859 kg of dry parchment coffeeThat equates to 389 arrobas/year, or 97 arrobas/hectare over the 4 hectares. If the farm produces less than that, it is operating at a loss. If it produces more, each additional kilogram contributes $5,310 of direct margin to profit. That figure changes the entire conversation: it is no longer about "working hard this year"; it is about knowing exactly how many kilograms this farm needs to produce to ensure its viability, and how many above that threshold mean real profit.Applying it to the dairy farm in the example:
- Total fixed + indirect costs: $65,500,000
- Price per liter: $2,200
- Variable cost/liter: $108,200,000 ÷ 91,500 = $1,182/liter
- Contribution margin per liter: $2,200 - $1,182 = $1,018/liter
Break-even point = $65,500,000 ÷ $1,018 = 64,342 liters/yearThis means that the farm needs to produce at least 176 liters daily to cover all its costs. Above that, each additional liter contributes $1,018 to profit. If in a dry season with poor pasture conditions production drops to 150 liters/day, the producer immediately knows they are losing money and can make technical decisions (strategic supplementation, adjusting animal load, culling unproductive cows) before the loss accumulates.
This type of analysis separates reactive management (where the producer learns of the problem at the end of the year when there is nothing left to do) from predictive management (where every month actual production is contrasted against the break-even point and the course is adjusted).

How to evaluate profitability that allows growth
Knowing the cost and the break-even point is the baseline. Knowing if your farm is growing or just surviving requires looking at other indicators that cross profitability with reinvestment capacity.
Margin per hectare (crops) or per UGG (livestock): It is the net profit divided by the productive unit. In the coffee farm example, $3,175,000/ha. This indicator allows you to compare your farm against regional averages and against lots within the same farm, identifying which are sustaining the business and which are detracting.
Annual ROI (Return on Investment): Net profit ÷ total investment × 100. In agriculture, the reasonable ROI for consolidated perennial systems like coffee, avocado, or palm ranges between 12% and 25% annually when the farm is well managed. In dairy farming in Colombia, the indicators documented by FEDEGÁN show historically low profitability rates, often between 3% and 8% annually.
Percentage contribution margin: (Price - Variable Cost) ÷ Price × 100. In the coffee farm example, it is 44%; in the dairy farm, it is 46%. A low contribution margin (below 30%) indicates that the farm has very little room to absorb increases in variable costs and needs either to improve selling prices or reduce inputs.
Reinvestment capacity: It is the profit available after covering family needs and financial obligations, which remains to invest in productive improvements (renewal of lots, genetic improvement, infrastructure, new technologies). Without reinvestment capacity, a farm does not grow: it only maintains itself. And in an environment of rising costs and demanding markets, maintaining is regressing.
These four indicators, calculated at least once per production cycle, are what differentiate a producer who manages from one who merely produces. Most of the farms I have seen grow sustainably in recent years are not the largest or those with the best climate; they are the ones that keep records and analyze them periodically.
The Harvis Insight: the hidden pattern in agricultural costs
When Harvis processes cost records from a farm over several production cycles, there is a pattern that appears with striking consistency: farms that keep detailed records of their costs for at least 6 consecutive months reduce their total costs by between 8% and 15% in the following cycle, without reducing production.
This is not magic. It is what happens when the producer starts to see costs disaggregated by category and by moment of the cycle: they immediately detect overapplications of inputs, poorly distributed wages, concentrated purchases at high price moments that could have been staggered, inventory discards due to poor rotation. What was once a decision by habit becomes a decision by analysis.
Another recurring pattern in livestock systems: the simple systematic application of FIFO in managing input inventory generates documentable savings between 3% and 7% in the first 12 months, simply by reducing losses due to expiration, deterioration, and waste. That is money you are already spending but not capitalizing.
Building the system, not just measuring the result
A cost analysis is not an exercise done at the end of the year when the accountant arrives; it is a system built throughout the entire production cycle. For it to work, it needs three minimum conditions: timely records (noting each expense at the moment it occurs, not reconstructing it from memory months later), consistent categorization (maintaining the same classification criteria between fixed, variable, and indirect over time), and periodic review (at least monthly, ideally biweekly) that allows comparing what was budgeted against what was executed.
With Harvis, you can record your daily tasks, your input inventories, your wages, your productions, and your income, and from there automatically obtain your cost indicators per unit produced, margins per lot or per productive line, updated break-even points, and trends over time that allow you to make decisions with real data and not with feelings. Agricultural management has ceased to be a notebook written with pencil at the end of the day. Today it is a living system that updates with each task and puts the key numbers in your hand when you need them.
The question is not whether your farm produces. The question is whether your farm profits, how much it profits, and whether what it profits is enough to grow. Without serious cost analysis, none of those questions have answers. And without answers to those questions, agricultural management is not management; it is hope.
Consulted References
- Londoño Rendón, J. (2024). Production costs of coffee 2023: Colombia [Report]. Coffee, Forest, and Climate Agreement. https://acuerdocafebosqueyclima.com/wp-content/uploads/2024/07/Informe-Costos-cafe-2023-1.pdf
- Londoño Rendón, J. (2022). Production costs of coffee 2020: Colombia [Report]. Solidaridad Latam. https://solidaridadlatam.org/wp-content/uploads/2022/02/200607-informeCostos_2020.pdf
- Colombian Federation of Cattlemen (FEDEGAN). (2024). The high cost of producing milk in Colombia: cost structure and profitability [Report]. Planning and Economic Studies Office. https://estadisticas.fedegan.org.co/DOC/download.jsp?pRealName=ElAltoCostodeProducir_Leche.pdf&iIdFiles=1069
- Colombian Corporation for Agricultural Research (AGROSAVIA). (n.d.). Cost and financial analysis manual for the beef cattle production system in the Colombian Orinoquía: fixed, variable, and working capital costs. https://repository.agrosavia.co/server/api/core/bitstreams/b7ddfbe2-7ade-4b94-88f9-b0b9a804ddc7/content
- Botero A., L., & Rodríguez M., D. (2006). Cost of producing a liter of milk in a dual-purpose livestock system, Magangué, Bolívar. Revista MVZ Córdoba, 11(2), 806–815. http://www.scielo.org.co/scielo.php?script=sci_arttext&pid=S0122-02682006000200005
- Eljach Rivera, D. (2017). Analysis of the production costs of milk in ten (10) specialized dairy farms associated with the Colanta cooperative in the municipality of Sonsón (Antioquia) [Undergraduate thesis, Politécnico Colombiano Jaime Isaza Cadavid]. https://repositorio.elpoli.edu.co/server/api/core/bitstreams/6e40d5a6-275b-4943-8a9d-38f95159ca68/content
- National Development Finance (FINAGRO). (2017). Dairy farming: Agro-Economic Reference Framework. https://www.finagro.com.co/sites/default/files/node/basic-page/files/ganaderia_leche.pdf
- Rural Agricultural Planning Unit (UPRA). (2024). Production cost sheet in dual-purpose bovine livestock — Valle del Cauca. https://upra.gov.co/sites/default/files/2025-03/01_FCLBov2PValle.pdf
- Gerencie.com. (n.d.). FIFO method: inventory valuation, applied example, and accounting effect. Retrieved May 14, 2026, from https://www.gerencie.com/metodo-peps.html
- Harvis. (n.d.). Proper management of antibiotics in milk production systems: traceability and safety. Retrieved May 14, 2026, from https://harvis.app/blog/manejo-antibioticos
- Stripe. (2025). How to calculate the break-even point?: profitability analysis and minimum operating threshold. https://stripe.com/es/resources/more/how-to-calculate-the-break-even-point
- Pipedrive. (2024). Break-even point: formulas, contribution margin, and practical examples. https://www.pipedrive.com/es/blog/punto-de-equilibrio
- TOTVS. (2024). Agricultural production cost: importance, break-even point calculation, and productive efficiency. https://es.totvs.com/blog/gestion-agricola/costo-de-produccion-agricola-importancia-y-como-calcularlo/
- National Development Finance (FINAGRO). (2022). Agro-Economic Reference Framework — Coffee Castillo: sensitivity analysis and profit margins. https://www.finagro.com.co/sites/default/files/2022-05/cafe_castillo.pdf