

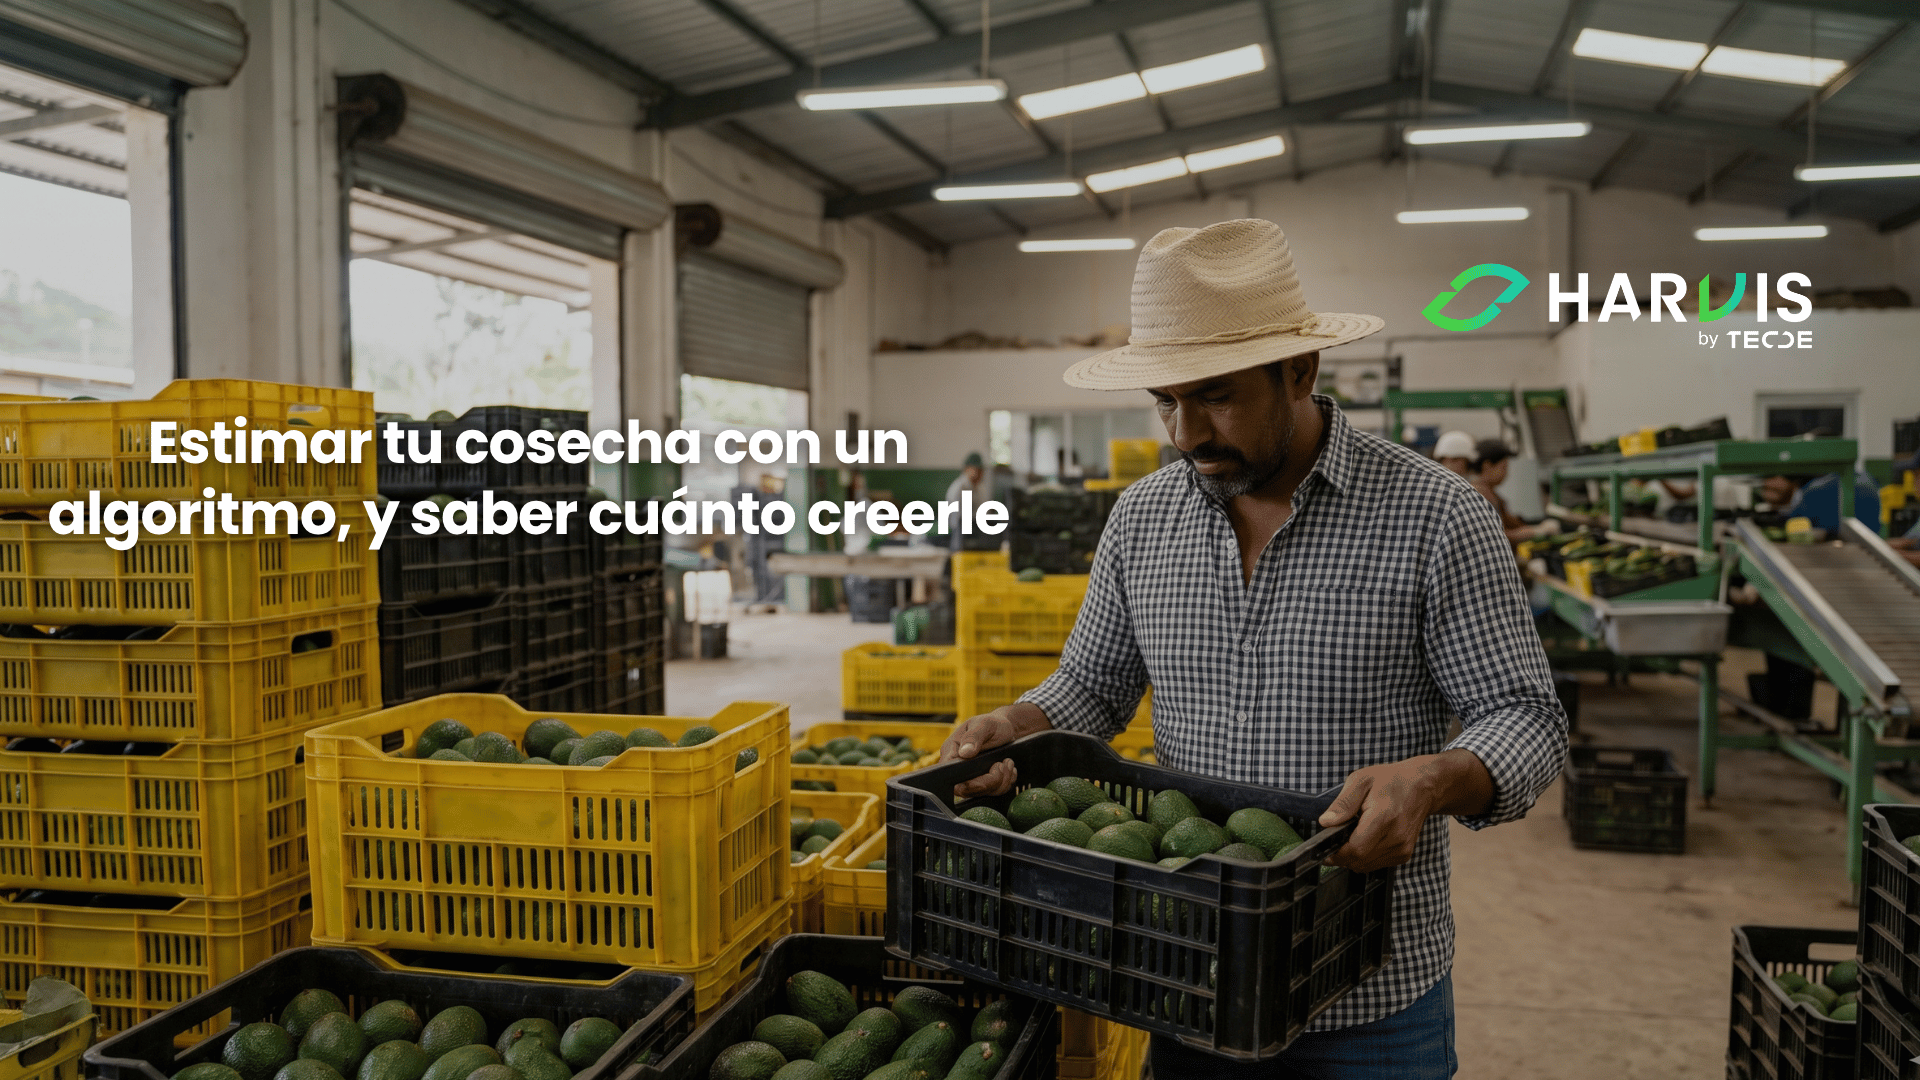
The fruit detection models published in recent years report coefficients of determination of 0.98 for mango, 0.98 for apple, 0.96 for tomato, and 0.95 for citrus, even under variable lighting conditions. With those figures circulating for years, almost no fruit farm in the region estimates its harvest today with a model, and most continue to project volume based on last year's results adjusted by eye according to how the lot looks. This gap is not explained by a lack of technology or producer distrust; it is explained because those numbers were measured under conditions that rarely match those of a commercial orchard, and because it is almost never written what those conditions were.
As we opened this season, we projected that we would explore satellites, drones, and the models that convert those images into usable information. The previous four blogs resolved the imaging part, what a sensor measures and where it lies, when centimeter resolution pays off, how to separate a health alert from a diagnosis, and how to convert a map into applicable doses. What remains is the piece that gives economic sense to all of the above, because the question a buyer asks you is not how vigorous your lot is, but how many kilos you will deliver and when.
It is advisable to enter knowing what can be asked. Automatic harvest estimation works reasonably well for an aggregated number of the lot just before harvest, and it works poorly for predicting tree by tree months in advance. This boundary is what this blog wants to clarify, because it is exactly where projects that start with enthusiasm and end up in a folder that no one opens break down.
Counting fruit is not estimating harvest, and the difference is called occlusion
All the difficulty of the problem fits into a banal observation: the camera only sees what is not covered. A fruit behind a leaf, behind a branch, or behind another fruit does not exist for the algorithm, and in a closed canopy, that invisible fraction is enormous. That is why direct counting from the air has a ceiling that no software improvement can raise, and why the studies that report the most spectacular figures almost always worked from the ground, one meter from the plant and with the camera pointing inside the canopy.
A recent study measures it plainly. A team collected three-dimensional point clouds of a complete apple orchard with a drone and a low-cost RGB camera over two seasons, and adjusted fruit counting models by block. The counting reached coefficients of determination of only 0.40 to 0.53, while equivalent methods taken from the ground reached 0.80 and 0.85 in the same task. The authors themselves explain the difference: a set of images taken from a drone delivers less spatial resolution and a worse angle to obtain information from inside the canopy.
When that same work moved from counting fruits to estimating harvested mass, multiplying the estimated volume of fruit by the average density of the variety, the coefficients rose to 0.56 and 0.76 depending on flight height. The very useful practical reading is that the model estimates better how many kilos there are than how many fruits there are, because counting errors compensate for each other when aggregated at the block scale, while at the individual tree level they add up. Keep that idea, because it comes back two sections later when we talk about the figure that is most cited in this business.
The study also left a warning about operation that is worth its weight. The last flown row in each campaign delivered coefficients of 0.00 and 0.03, against an average of 0.52 in the other rows, simply because the outer edge of that row was captured in fewer photographs. A poorly closed flight plan does not produce a slightly worse data point; it produces a data point with no value across an entire strip of the lot.
The three paths to reach the number: direct counting, vigor index, and history
There are three ways to estimate, and none wins in all windows of the cycle, so the correct decision is almost never to choose one.
Direct counting through artificial vision is the most intuitive and the most demanding. It requires visible and ripe fruit or at least fruit with differentiated color, which in practice confines it to the weeks before harvest, and it requires close-up images, which in closed-canopy fruit trees pushes towards cameras mounted on ground vehicles or low and oblique flights instead of zenith flights. In blueberries, a crop where the fruit is small but the plant is low and accessible, recent developments with real-time detection architectures report detection of 81.7 percent of fruits with an overall accuracy of 87.2 percent, correct maturity classification 93 percent of the time, and yield estimation per plant with a match of 93 percent against actual weight. That performance is real and also a clue; the low plant with foliage that does not completely close is the most favorable geometry for this technology.
The vigor index path is indirect and operates many months in advance. It does not measure fruit; it measures the accumulated photosynthetic capacity of the tree and translates it into expected yield through a statistical relationship built with your own history. It is the only one of the three that works during flowering and fruit set, and its weak point is that this relationship breaks when the campaign's weather deviates from the pattern it was adjusted to.
The yield history per management unit is the oldest, cheapest, and most underestimated. In many lots, the best predictor of next year's yield is the average yield of that same site in previous campaigns, corrected for load and age, and that does not require any sensor. Multi-year satellite series are used precisely to classify the productive stability of each sector of the lot and separate the structural from the circumstantial.
What the evidence suggests is to combine them by window. History and vigor for the early projection that serves to plan labor and commit volume, direct counting for the fine-tuning of the last weeks that serves to size transport and packaging.
Knowing the volume before the buyer arrives
How many weeks in advance can you say today, with a number and not with a vague range, how many kilos you will take from each lot? In most farms, that figure appears when it is already weighed, which is just when it stops being useful for negotiating, hiring pickers, or reserving transport. Harvis helps you build that projection with what you already have, crossing your harvest history by lot, your flowering and labor records, and your team's field observations, so that the estimate exists before harvest and so that at the end you can compare what was projected against what was delivered and correct the method for the next year. Write to us and we will review what data you can start with.
Why the supplier's model doesn't reach your farm
The problem is not the quality of the algorithm; it is that the algorithm learned to see a farm that is not yours. Reviews on automated detection in crops consistently point out that the central limitation lies in the diversity of training data and not in the architecture, and that the performance reported in validation rarely holds when changing environments. Variety, pattern, age, planting density, training system, pruning intensity, and color of bare soil modify both the appearance of the fruit and the fraction that remains covered, and both things directly affect the result.
Occlusion, again, is the concrete mechanism of that failure. In studies on bunch detection with point clouds from drones, models only surpassed a coefficient of 0.75 when leaves were removed from both sides of the row to expose the fruit, a testing condition that no commercial farm will reproduce. In low shrubs with sparse foliage, detection is reliable, and in tall plants where foliage covers the fruit, the same technique loses effectiveness. Your pruning system, then, is not an agronomic detail unrelated to this conversation; it is one of the variables that decides whether the technology will be useful to you.
There is a third factor that almost no one mentions in the quote: light. Automatic fruit identification on color images faces well-documented difficulties with variable lighting, saturated regions, shadows, and heterogeneous backgrounds, and that effect is strong. Two flights over the same lot, one with clear skies at eleven and another with intermittent clouds at three, do not produce comparable counts. As was the case with the thermal we saw in the delivery on health, the discipline of capture is worth more than the sophistication of the model.
What an estimation error costs you in practice
It is worth putting the error in pesos, because in abstract a twenty percent deviation sounds tolerable, and in operation it is not.
If you overestimate, you hire pickers that you will not use, reserve transport that will travel half full, order packaging that stays in the warehouse, and in the worst case, you commit to a buyer a volume that you cannot deliver later, which is paid in penalties or in credibility. If you underestimate, the opposite happens and it is usually more expensive, because you get emergency pickers at emergency rates, the fruit waits on the tree longer than it should, and you lose quality just at the point where the price is defined. In the apple study, estimates for one of the campaigns were systematically high, with blocks estimated above 255 kilos when the actual reference of the orchard ranged from 63 to 168 kilos per block; an error of that magnitude applied to a complete farm disrupts the entire logistics of the season.
As we already addressed in our blog Harvest Planning, a strategic practice to not leave your money to chance, volume and date projection is what allows you to stagger the harvest, negotiate before the peak of supply, and size the crew in advance; an automatic estimate is only worth as much as the decision it enables, and without a harvest plan behind it, the best model in the world delivers a number that no one uses.
Thirty trees, a scale, and a notebook
The sensible way to start is not by hiring an estimation service for the entire farm, but by building your own correction factor in one campaign, at almost no cost.
Choose a representative lot and mark between thirty and forty trees that cover the entire range of load, from several clearly loaded to several light and several intermediate, and geo-reference each one so you can return. About three or four weeks before harvest, do two things on the same day. First, count the visible fruit of each marked tree from the outside, with the criteria with which a camera would see it, and note that number. Second, if you have access to a flight or close-up photography, capture it at that same moment with stable skies and in the same time frame.
When harvesting, weigh the fruit of each marked tree separately. The relationship between the actual weight and the visible count is your local correction factor, and it will be a number greater than one because there is always covered fruit. That factor, which no publication can give you, is what turns a count into an estimate. Also calculate how much it varies between trees, because that dispersion is what defines the honest margin you should report when someone asks you how many kilos you will deliver.
Repeat the exercise the following campaign and add the trees that have changed load. With two campaigns, you have a stable relationship, and with three, you have something that can support a commercial decision. The same table serves to audit any supplier that comes later, because you will be able to compare their estimate against your actual weight instead of against their own promise.
A number with margin is worth more than a round hunch
Estimating harvest with technology does not consist of replacing your judgment with an algorithm; it consists of putting an explicit margin on a figure that you currently handle without margin. When you say you will take out forty tons, you are giving a number without declared uncertainty, and that false precision is what leads you to commit to a volume that later does not appear. A well-constructed model does not give you a prettier number; it gives you a defensible range and a way to narrow it down each year.
What you can start doing this week fits into five decisions. Mark thirty trees with visible counting and individual weighing at harvest, because your local correction factor is the asset that no supplier sells you. Estimate the aggregated mass by lot instead of chasing the count tree by tree, as evidence shows that aggregation improves the result and individual detail worsens it. For any precision figure presented to you, ask about what unit it was measured in, in how many farms, with how much anticipation, and against what actual weight. Set the capture window, stable skies, and the same time frame, because two flights with different light are not comparable, and that detail ruins more projects than the choice of software. And keep every campaign the pair of data, what you estimated and what you delivered, because your own series is the only thing that turns this into a tool and not an experiment. The producer who arrives at the negotiation with a range built on their own history is in a different conversation than the one who arrives with a round figure pulled from memory.
Do you want to build your farm's harvest projection with the data you are already generating? Write to us via WhatsApp or schedule a demo, and we will show you how Harvis organizes your history by lot so that the estimate exists before harvest and not after.
Consulted References
- Deep learning based fruit detection performance across crops, synthesis of results in automatic fruit detection. (n.d.). ScienceDirect. https://www.sciencedirect.com/science/article/abs/pii/S0263224124006717
- Fruit Detection and Yield Mass Estimation from a UAV Based RGB Dense Cloud for an Apple Orchard. (2025). Drones, MDPI. https://www.mdpi.com/2504-446X/9/1/60
- YOLO-blueberry detection and classification, a multi-module optimized network for detection, maturity classification and yield estimation. (n.d.). Agronomy Journal, Wiley. https://acsess.onlinelibrary.wiley.com/doi/abs/10.1002/agj2.70343
- Assessment of yield stability patterns using Sentinel-2 over a 7-year period. (2025). Geocarto International, Taylor & Francis. https://www.tandfonline.com/doi/full/10.1080/10106049.2025.2532529
- Autonomous Yield Estimation System for Small Commercial Orchards Using UAV and AI. (2024). ResearchGate. https://www.researchgate.net/publication/386449492AutonomousYieldEstimationSystemforSmallCommercialOrchardsUsingUAVandAI
- A review on automated plant disease detection, motivation, limitations, challenges, and recent advancements. (2025). Springer. https://link.springer.com/article/10.1007/s44443-025-00040-3
- Quantifying Bilberry Counts and Densities, A Comparative Assessment of Segmentation and Object Detection Models from Drone and Camera Imagery. (n.d.). Forests, MDPI. https://doi.org/10.3390/f17020253
- Accurate Crop Yield Estimation of Blueberries using Deep Learning and Smart Drones. (2025). arXiv. https://arxiv.org/abs/2501.02344
- In-field blueberry fruit phenotyping with a MARS-PhenoBot and customized BerryNet. (2025). Computers and Electronics in Agriculture / ScienceDirect. https://www.sciencedirect.com/science/article/abs/pii/S0168169925001632
- Apple Yield Estimation Method Based on CBAM-ECA-Deeplabv3+ Image Segmentation and Multi-Source Feature Fusion. (2025). PMC. https://www.ncbi.nlm.nih.gov/pmc/articles/PMC12116164/
- Deep learning framework for fruit counting and yield mapping in tart cherry using YOLOv8 and YOLO11. (2025). ScienceDirect. https://www.sciencedirect.com/science/article/pii/S2772375525001819
- A fast and efficient approach to estimate wild blueberry yield using machine learning with drone photography, flight altitude, sampling method and model effects. (n.d.). Computers and Electronics in Agriculture. https://dl.acm.org/doi/abs/10.1016/j.compag.2023.108543
- The Evolution of Data-Driven Management Zone Delineation, A Systematic Review. (2026). Sensors, MDPI. https://doi.org/10.3390/s26103249
- Optimizing integration techniques for UAS and satellite image data in precision agriculture, a review. (2025). Frontiers in Remote Sensing. https://www.frontiersin.org/journals/remote-sensing/articles/10.3389/frsen.2025.1622884/full