

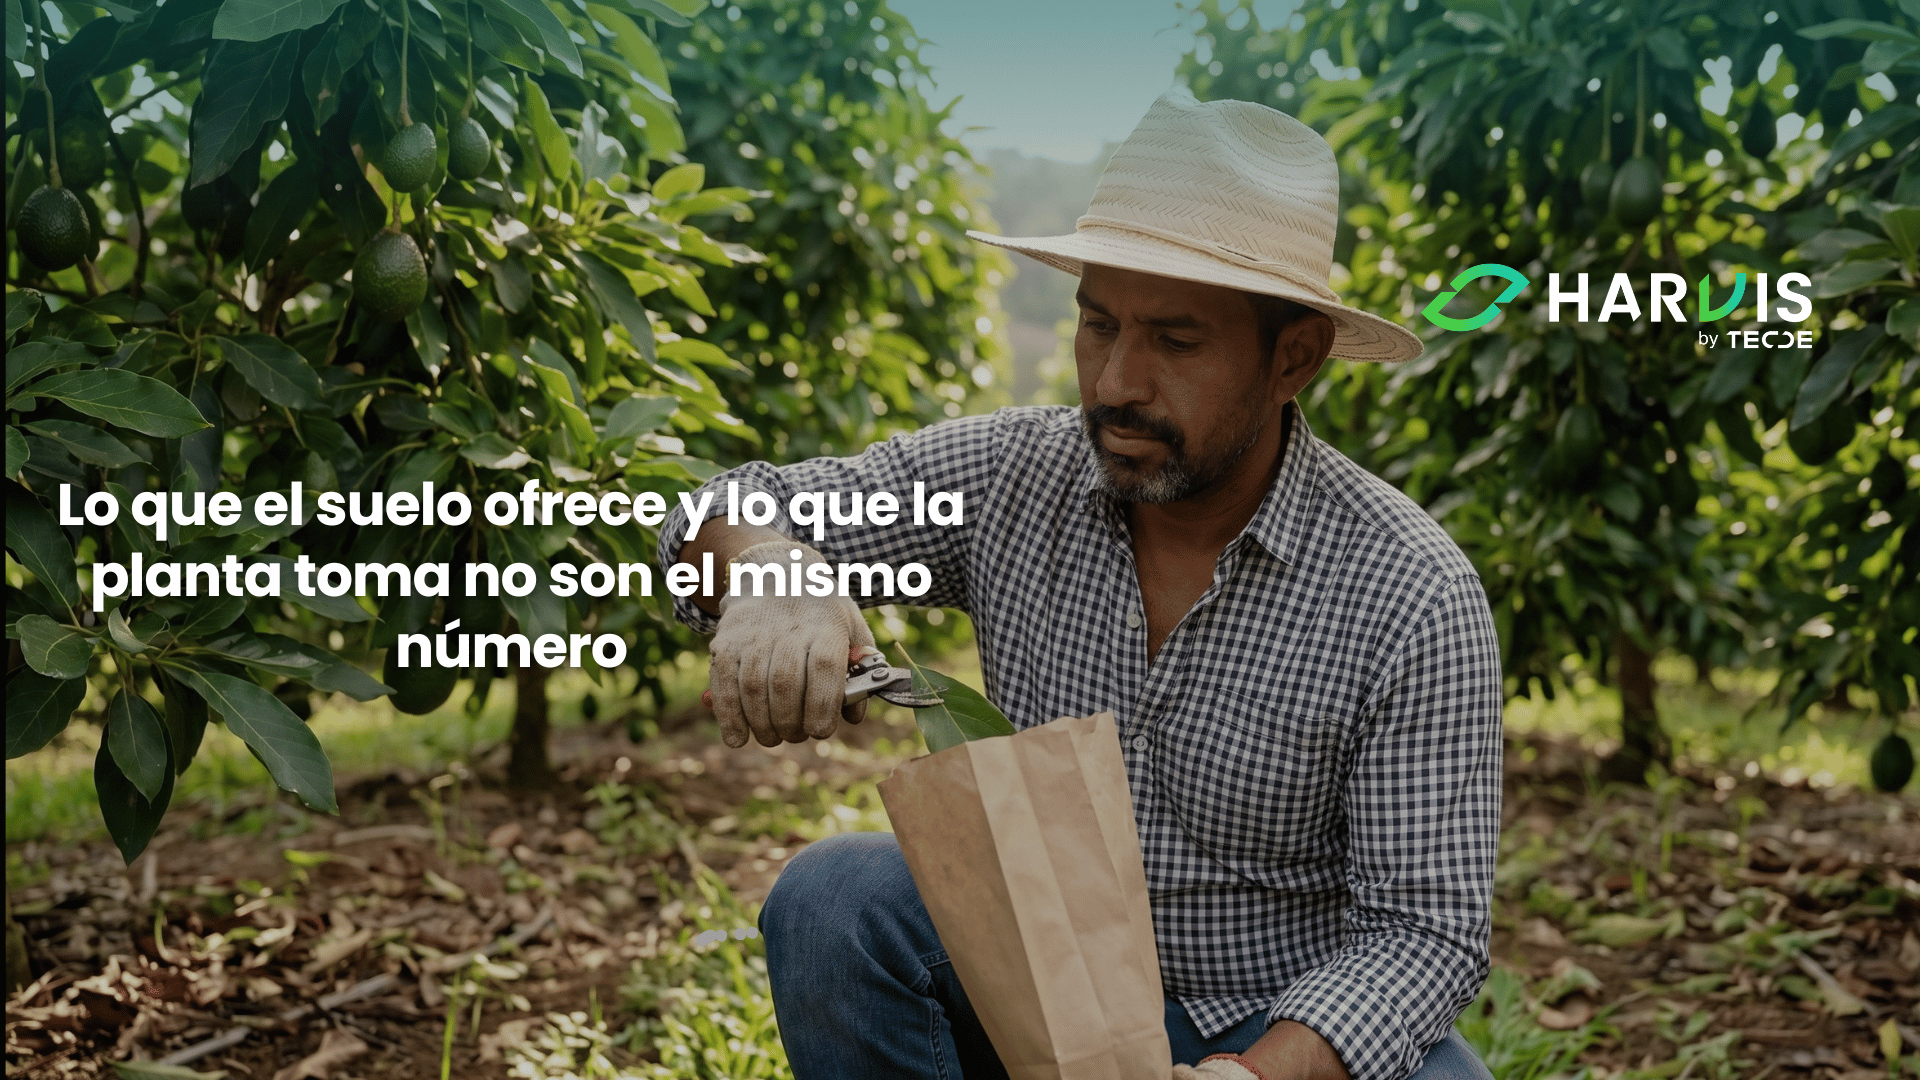
Ask ten producers what a soil analysis is for, and nine will answer the same thing: that it serves to know what the crop lacks. That is not what it measures. A soil analysis measures how much of each element a laboratory reagent can extract from a dry, sieved soil sample, under pH, temperature, and agitation conditions that are not those of your field or your root. It is a measure of potential supply, it is a useful measure and worth every peso it costs, but between that supply and what the plant actually absorbed lies a journey with losses, blockages, competition between ions, and a root that may be limited by compaction, excess moisture, or health damage, reasons that have nothing to do with the chemical fertility of the soil. This journey explains why a field with a flawless soil analysis may be producing poorly, and it also explains why two fields with the same analysis and the same fertilization plan end the campaign with different yields.
The previous season covered the specific pests of coffee, Hass avocado, and citrus, and closed with the operational layer of biological control. This season changes the subject and enters precision nutrition, which in this blog already has a built foundation, with nitrogen and its losses, phosphorus that the soil fixes, the balance between cations, microelements, organic matter, and the biology that mineralizes. All of that dealt with the supply of the soil and how much to apply. What remains to be explored is the other axis, that of diagnosis within the plant and that of synchronization over time, and it will occupy the next five blogs.
It is advisable to enter with the right expectations, because leaf analysis is sold with more enthusiasm than the evidence supports. It is not a tool that tells you how much to fertilize, it does not replace soil analysis, and it does not explain by itself the yield of your field. What it does do, and it does better than any other available measurement, is tell you if what you applied reached the plant, which nutrient is unbalanced compared to the others, and in what order it is advisable to correct. Used this way, it organizes decisions that are currently made by intuition; used as an oracle, it disappoints.
Two different questions that end up in the same folder
A soil analysis and a leaf analysis answer different questions, and confusing them is the most common mistake in this discussion.
The soil analysis answers what is available for the land to offer. The leaf analysis answers what the plant managed to take from that supply, which incorporates in a single number the state of the root, the soil moisture during the absorption period, the competition between ions, and the real efficiency of what you applied. They are complementary, and neither replaces the other, because a low leaf value may mean that the nutrient is not in the soil or that it is there but the plant could not take it, and only the soil analysis allows you to distinguish between those two scenarios.
The practical consequence of having both readings is that it changes the type of decision you can make. With only the soil analysis, your only lever is the dose. With both readings together, other levers appear that usually cost less, the source of the fertilizer, the timing of the application, pH correction, street decompaction, or irrigation review. A producer who sees sufficient potassium in the soil and deficient in the leaf does not have a dose problem; they have an absorption problem, and increasing the bulk is the most expensive and least effective response to that diagnosis.
There is a third difference that weighs on logistics. The soil analysis can be taken practically at any time of the year as long as you maintain the same timing between campaigns, while the leaf analysis has narrow and non-negotiable windows, because the concentration of nutrients in the leaf changes throughout the year as the leaf ages and as the fruit competes for the same elements. A leaf sample taken outside the window is not an imprecise sample; it is a sample that cannot be compared against anything.
The number that almost no one cites when selling a leaf analysis
A recent study built nutritional standards for Hass from commercial orchards, with yield and leaf content data collected between 2021 and 2024 in four farms, separating the set into two groups, 123 lots of trees aged four to nine years and 53 lots of trees aged ten to twenty-six. It is the type of database that almost never exists for our crops, and that is why it is worth looking at closely.
The result that is worth keeping in mind is this. The nutritional balance measured with the simplest method explained 11 percent of the yield variation in young trees, and the multivariate method explained 14 percent in both age groups. Said plainly, between 86 and 89 percent of the yield difference between lots is due to factors that the leaf analysis does not capture, starting with climate, health, age, density, and water management.
That number does not disqualify the tool; it places it. A 14 percent variance in yield is a large portion of the part of the result that you effectively control with nutrition decisions, and it is a portion that today most farms manage blindly. The practical reading is that leaf analysis deserves a line in the budget and does not deserve the expectation that it will resolve a lot with drainage or health problems, which is exactly where producers who try it once and do not return get frustrated.
There is a detail from the same work that helps calibrate confidence. In trees aged ten to twenty-six years, the simplest method did not yield a statistically significant relationship with yield, while the multivariate method did. In old trees, yield depends on so many accumulated factors that the nutritional signal dilutes, and that is why the standards and ranges you use must correspond to the age group of your lot and not to the average of the crop.
The sample matters, branch without fruit, leaf age, and a paper bag
All of the above assumes that the sample is well taken, and in practice, that is where most of the value of the exercise is lost.
The protocols are surprisingly specific and coincide among crops in essence. In citrus, the recommendation is to gather 100 leaves from fruitless branches, taken from 15 to 20 uniform trees chosen at random within a block of no more than eight hectares, targeting spring shoots aged four to six months, with the petiole attached and washed the same day of collection. In avocado, the protocol asks for four complete leaves per tree, one from each quadrant, taken from the third node of fruitless shoots and without new vegetative growth, from more than ten trees per block. In both cases, the sample must correspond to the same variety, the same rootstock, and the same fertilization plan, because mixing different conditions produces an average that does not describe any.
Behind each of those requirements lies a measurable reason. The leaf of a branch with fruit has different concentrations than that of a branch without fruit, because the fruit is a competing destination that pulls nutrients; young leaves and old leaves differ for almost all elements; dust and residues from foliar sprays adhered to the surface artificially inflate the values of iron, manganese, zinc, and copper if not washed. Keep the issue of leaf age in mind, because it comes back later when we talk about what you are comparing your results against.
In farm terms, this means that leaf analysis is a task that requires a trained person and a written routine, not a task that is delegated to whoever is available. A sample taken quickly, from the most convenient branches at the edge of the lot, unwashed and stored for two days in a plastic bag inside the truck, produces a number that you will use to make monetary decisions throughout the year, and that number does not describe your lot. It is cheaper not to take the sample than to take it poorly, because a poorly taken sample gives you a false sense that you are deciding with data.
Sufficiency ranges, DRIS, and CND, three ways to read the same paper
When the result arrives, there are three ways to interpret it, and the difference between them changes the recommendation.
The traditional way is sufficiency ranges, which compare each nutrient against an interval considered optimal, so that foliar nitrogen in orange is classified as deficient below 2.2 percent, optimal between 2.5 and 2.7, and excessive above 3.0. It is simple, it is what most laboratories print, and it has a known weakness, which is that it reads each element separately as if nutrients do not compete with each other.
Balance methods correct just that. Instead of evaluating the absolute concentration of each nutrient, they calculate the relationships between pairs of nutrients and compare them against the relationships observed in the population of high-yielding lots, so that the diagnosis is not "you lack potassium" but "your potassium to calcium ratio is deviated compared to the lots that produce the most, and that imbalance is the most limiting of all." The operational advantage is that they deliver nutrients ordered by priority of correction, which matters a lot when the budget does not stretch to correct everything.
The multivariate method goes a step further and simultaneously considers all proportions of the set, including the fraction of tissue that is none of the measured nutrients. In the work on Hass, it was the one that best associated nutritional status with productivity, and it was the only one that worked in both age groups. It also yielded a thought-provoking data point: the order of requirement turned out to be nitrogen, then calcium, and then potassium, while extraction studies by fruit in other producing countries report potassium first. Tree requirement and fruit extraction are not the same thing, and confusing them leads to fertilizing last year's harvest instead of this year's tree.
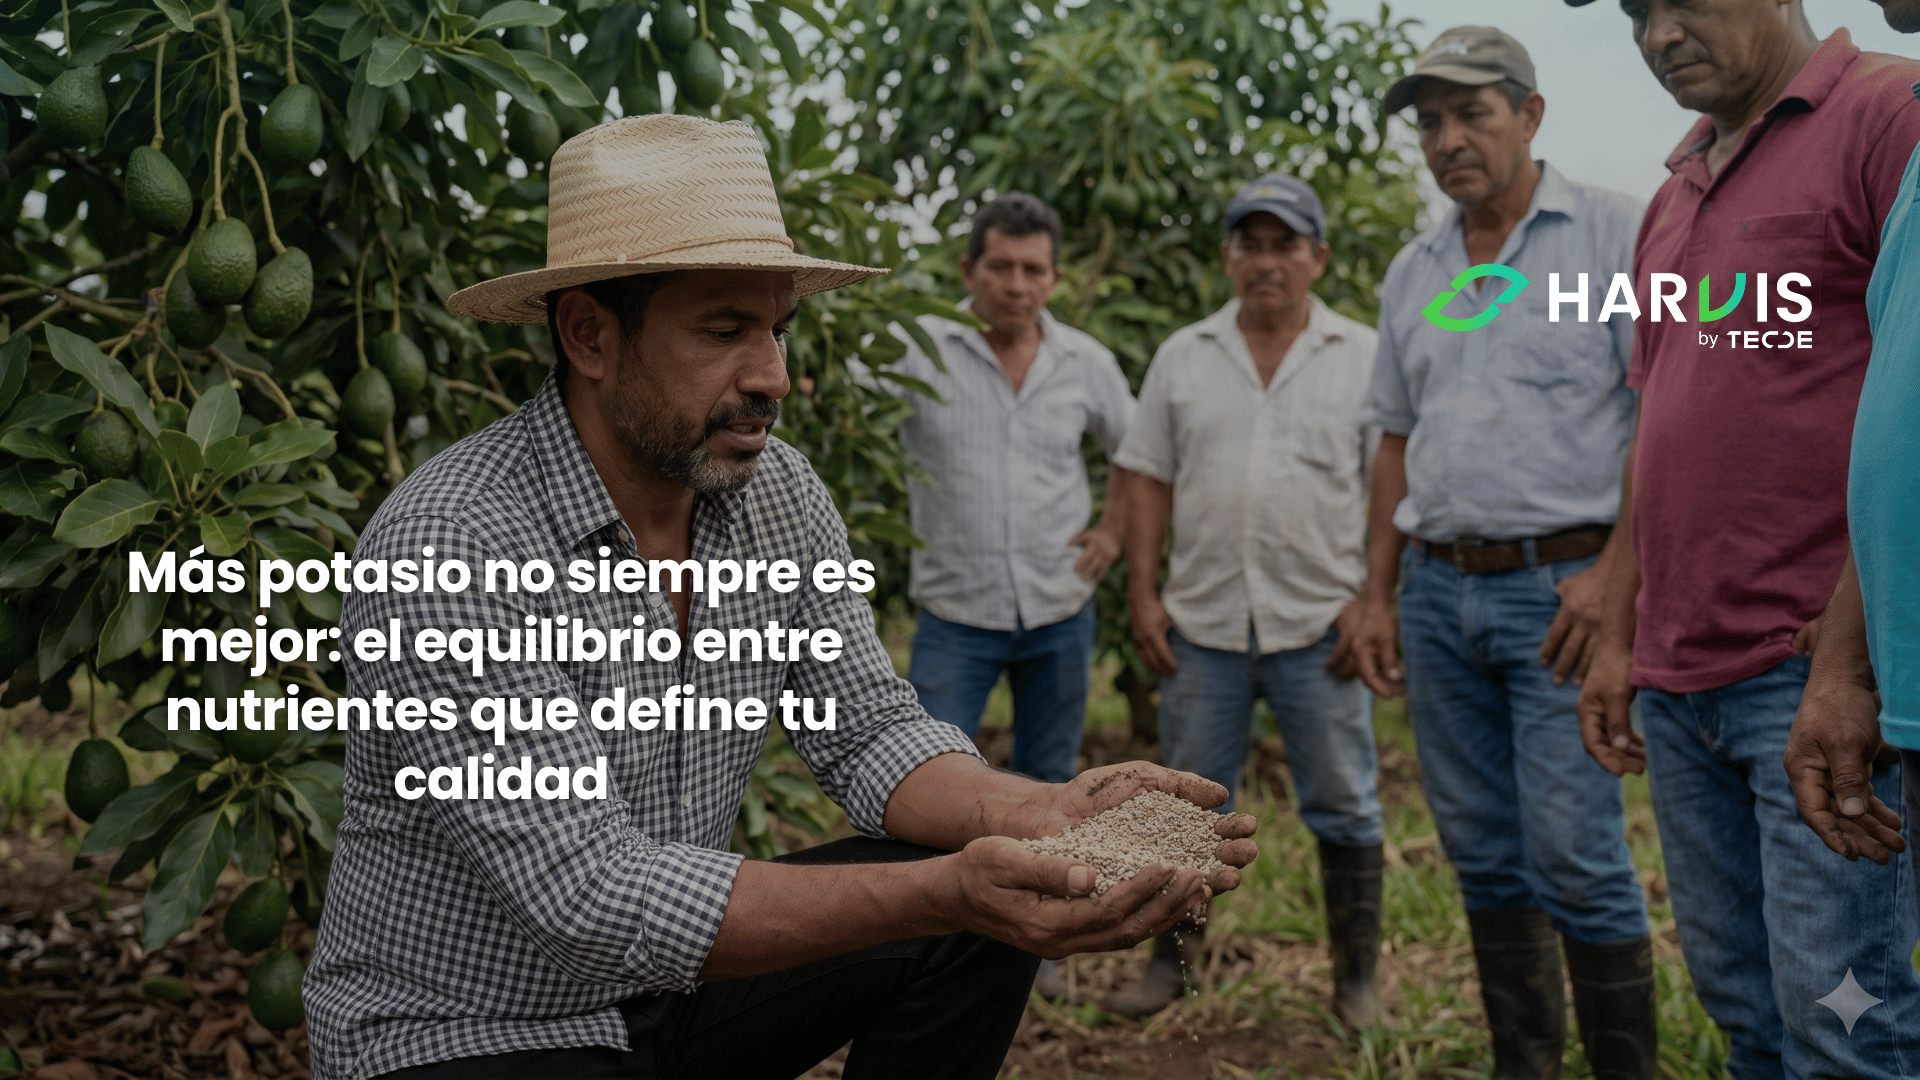
As we have already addressed in our blog More potassium is not always better, the balance between nutrients that defines your quality, which you can read here, potassium, calcium, and magnesium compete to enter the root, and applying more of one can provoke the deficiency of another; balance methods are exactly that idea turned into a laboratory procedure, because instead of asking how much potassium there is, they ask how much potassium there is in relation to the calcium and magnesium that accompany it, which is the question that the root actually faces.
Knowing which lot sent which sample
Could you today reconstruct, without calling anyone, from which lot each leaf sample from last year came, on what date it was taken, what age the shoot was, and what had been applied in the six weeks prior? In most farms, laboratory results live in an email, sampling dates in the memory of the person who took them, and applications on an invoice, so the series that would make the exercise valuable is never assembled, and each analysis is read as if it were the first. Harvis helps you record each sample with its lot, its date, and its shoot condition, to store the result alongside the historical applications of that same lot and to have the series of several years ready for comparison when the time comes to adjust the fertilization plan. Write to us, and we will set it up on the structure of lots you already manage.

What leaf analysis cannot tell you
The first limit has already been stated with numbers, and it is worth repeating because it is the one that produces the most disappointments. Nutritional status explains a minority fraction of the yield variation between lots, so if your problem is drainage, compaction, health, or genetic material, no fertilization adjustment will solve it, and the leaf analysis will send you to correct something that was not.
The second limit is that of the standards against which you compare, and here the issue of leaf age returns. The sufficiency ranges that your laboratory prints were built for a specific leaf age, a time of year, and specific edaphoclimatic conditions, and the Hass study itself points out that much of the guides in use are outdated and come from countries with different conditions. A table built for spring shoots aged four to six months does not serve to interpret a sample taken at another time, and a range built for another latitude can displace your entire diagnosis. If you are going to invest in this for several years, always ask the laboratory for the origin of the standard they are using.
The third limit is the variability of micronutrients. In the two age groups of the study, the coefficient of variation was systematically higher for micronutrients than for macronutrients, which means that readings of iron, manganese, zinc, copper, and boron are intrinsically noisier and require more repetitions before justifying a correction. A low zinc value in a single sample is not sufficient evidence to mount a foliar application program.
The fourth point is not a limit of the method but a warning about its trendy alternative. Sap analysis promises results in hours instead of days and is being strongly promoted, but the available evidence shows two serious problems: that results vary widely between laboratories, sometimes by an order of magnitude, and that the method poorly represents less mobile elements like calcium and boron, precisely because they do not circulate freely in the sap. The comparison between extraction methods confirms that the consistency of the pattern depends on the chosen procedure. It serves as a complement for mobile elements and for tracking within the same campaign; it does not serve, today, to replace dry tissue as a decision base.
A lot, forty leaves, and a paper bag
The exercise to start fits in one lot and one afternoon, and what costs is not the money but the discipline to repeat it the same way.
Choose a representative lot of your farm, of a single variety and a single rootstock, that has received the same fertilization plan throughout its extent, and mark it on the sketch. Define the sampling route once and for all, in a zigzag, entering the sectors where no one walks and deliberately excluding the two rows at the edge and the trees next to paths and warehouses. That route is what you will repeat every year, because the comparison between campaigns only matters if the sample was taken in the same place.
Take forty leaves if your crop is avocado, one from each quadrant in ten trees, or one hundred leaves if it is citrus, from fifteen to twenty trees, always from fruitless branches and from the shoot age indicated by your crop's protocol, with the petiole attached. Wash them the same day by gently rubbing them with your fingers in water with mild detergent and rinse them well, air dry them, and send them in a labeled paper bag, never in plastic. If you cannot wash them the same day, refrigerate them that night.
Record four things on the same form that the laboratory will not ask you and that are worth as much as the result: the exact date, the phenological state of the lot, the estimated fruit load, and the applications made in the six weeks prior. That fourth column is what will later allow you to distinguish a real high value from a poorly washed foliar residue.
Repeat it next year on the same date, on the same route, and with the same protocol. The first sample will not tell you much because you have nothing to compare it against; the third will show you trends by nutrient that no isolated analysis reveals, and that is where the exercise starts to pay off. That is the real commitment of leaf analysis, not a sample, but a series.
A well-taken leaf is worth more than an expensive analysis
The analysis industry sells laboratory precision, and the producer buys numbers with three decimals, when the part that decides the quality of the data occurs beforehand, in the lot, with a person, a scissors, and a bag. A sophisticated spectrometry team analyzing a poorly taken sample delivers an exact result of something that is not your crop, and that accuracy is precisely what makes the error go unnoticed. The distance between what the soil offers and what the plant takes can only be measured in the plant, and the measurement is worth whatever the sample is worth.
What you can do starting Monday fits into five decisions. Stop reading the soil analysis as a diagnosis of the crop and start reading it as what it is, a measure of the land's supply that needs a second reading in the plant to complete it. Define a written and fixed leaf sampling route for a representative lot, excluding edges and including uncomfortable sectors, and commit to repeating it on the same date for three years, because value appears in the series and not in the isolated data. Respect the three conditions that determine whether the sample is useful: branch without fruit, correct leaf age, and washing on the same day, and train a single person to do it. Ask your laboratory for the interpretation standards with their origin and leaf age, and distrust any recommendation built on a table that no one knows where it came from. And adjust expectations before spending, knowing that nutritional status explains a minority fraction of yield and that if your lot has a drainage or health problem, this will not solve it. The producer who reaches the third year with three comparable samples can see where each nutrient is moving in their farm; the one who sends a loose sample every so often will continue reacting to numbers they cannot interpret.
Do you want to keep track of your leaf samples by lot and by date, with the historical applications alongside, so that in three years the comparison is made? Write to us via WhatsApp or schedule a demo, and we will show you how Harvis organizes your analyses and your tasks within the same lot structure.
Consulted references
- Obreza, T. A., Zekri, M., Hanlon, E. A., Morgan, K., Schumann, A., and Rouse, R. Soil and Leaf Tissue Testing for Commercial Citrus Production. SL253.04, University of Florida, IFAS. https://edis.ifas.ufl.edu/ss531
- Vashisth, T., Burrow, J. D., Kadyampakeni, D., and Ferrarezi, R. S. (2025). Citrus Leaf Sampling Procedures for Nutrient Analysis. HS1355, University of Florida, IFAS. https://edis.ifas.ufl.edu/publication/HS1355
- CND and DRIS Methods for Nutritional Diagnosis in 'Hass' Avocado Production. (2025). Horticulturae, MDPI, 11(6), 621. https://www.mdpi.com/2311-7524/11/6/621
- University of California Cooperative Extension. Avocado Leaf Analysis Guide. https://ucanr.edu/county/cooperative-extension-ventura-county/avocado-leaf-analysis-guide
- California Department of Food and Agriculture. Plant Tissue Sampling in Orchards and Vineyards. https://apps1.cdfa.ca.gov/FertilizerResearch/docs/Orchard%5FTissue%5FSampling.pdf
- Diagnosis and Recommendation Integrated System (DRIS) approach on nutritional diagnosis in fruit crops, a review. Journal of Applied and Natural Science. https://journals.ansfoundation.org/index.php/jans/article/view/1134
- Evaluation of sap extraction methods for nutrient diagnostics in lettuce, cucumber, and tomato in controlled environments. (2026). Scientific Reports. https://www.nature.com/articles/s41598-026-52840-w
- Crushed, Squeezed or Pressed? How Extraction Methods Influence Sap Analysis. (2025). Agronomy, MDPI, 15(11), 2572. https://doi.org/10.3390/agronomy15112572
- Development of CND and DRIS Standards for High-Quality 'Hass' Avocado Seedling Production. (2025). Journal of Soil Science and Plant Nutrition, Springer. https://link.springer.com/article/10.1007/s42729-025-02740-1
- Efficient detection of nutrient deficiencies and development of corrections in avocado through the Compositional Nutrient Diagnosis (CND). Notulae Botanicae Horti Agrobotanici Cluj-Napoca. https://doi.org/10.15835/nbha52113118
- Proposition of critical levels of nutrients in citrus leaves grown in a subtropical climate for fresh market fruit production. Scientia Horticulturae, ScienceDirect. https://www.sciencedirect.com/science/article/abs/pii/S0304423823002194
- Obreza, T. A. and Morgan, K. T. (eds.). Nutrition of Florida Citrus Trees, second edition. SL253, University of Florida, IFAS. https://edis.ifas.ufl.edu/ss478
- University of California Cooperative Extension. Citrus Tissue Testing. https://ucanr.edu/sites/default/files/2010-12/63816.pdf
- Geisseler, D. Avocado Nutrient Management Guidelines. University of California, Davis. http://geisseler.ucdavis.edu/Guidelines/Avocado.html
- Sadeghian, S. et al. (2022). Determinants of nitrogen use efficiency in coffee crops, a review. Revista de Ciencias Agrícolas, 39(2). http://www.scielo.org.co/scielo.php?script=sci%5Farttext&pid=S0120-01352022000200198
- Nutrient dynamics in the berry, bean, and husk of six Coffea canephora genotypes throughout fruit maturation. (2025). Scientific Reports. https://www.nature.com/articles/s41598-025-13171-4
- Evaluation of real-time nutrient analysis of fertilized raspberry using petiole sap. PMC. https://www.ncbi.nlm.nih.gov/pmc/articles/PMC9389145/