

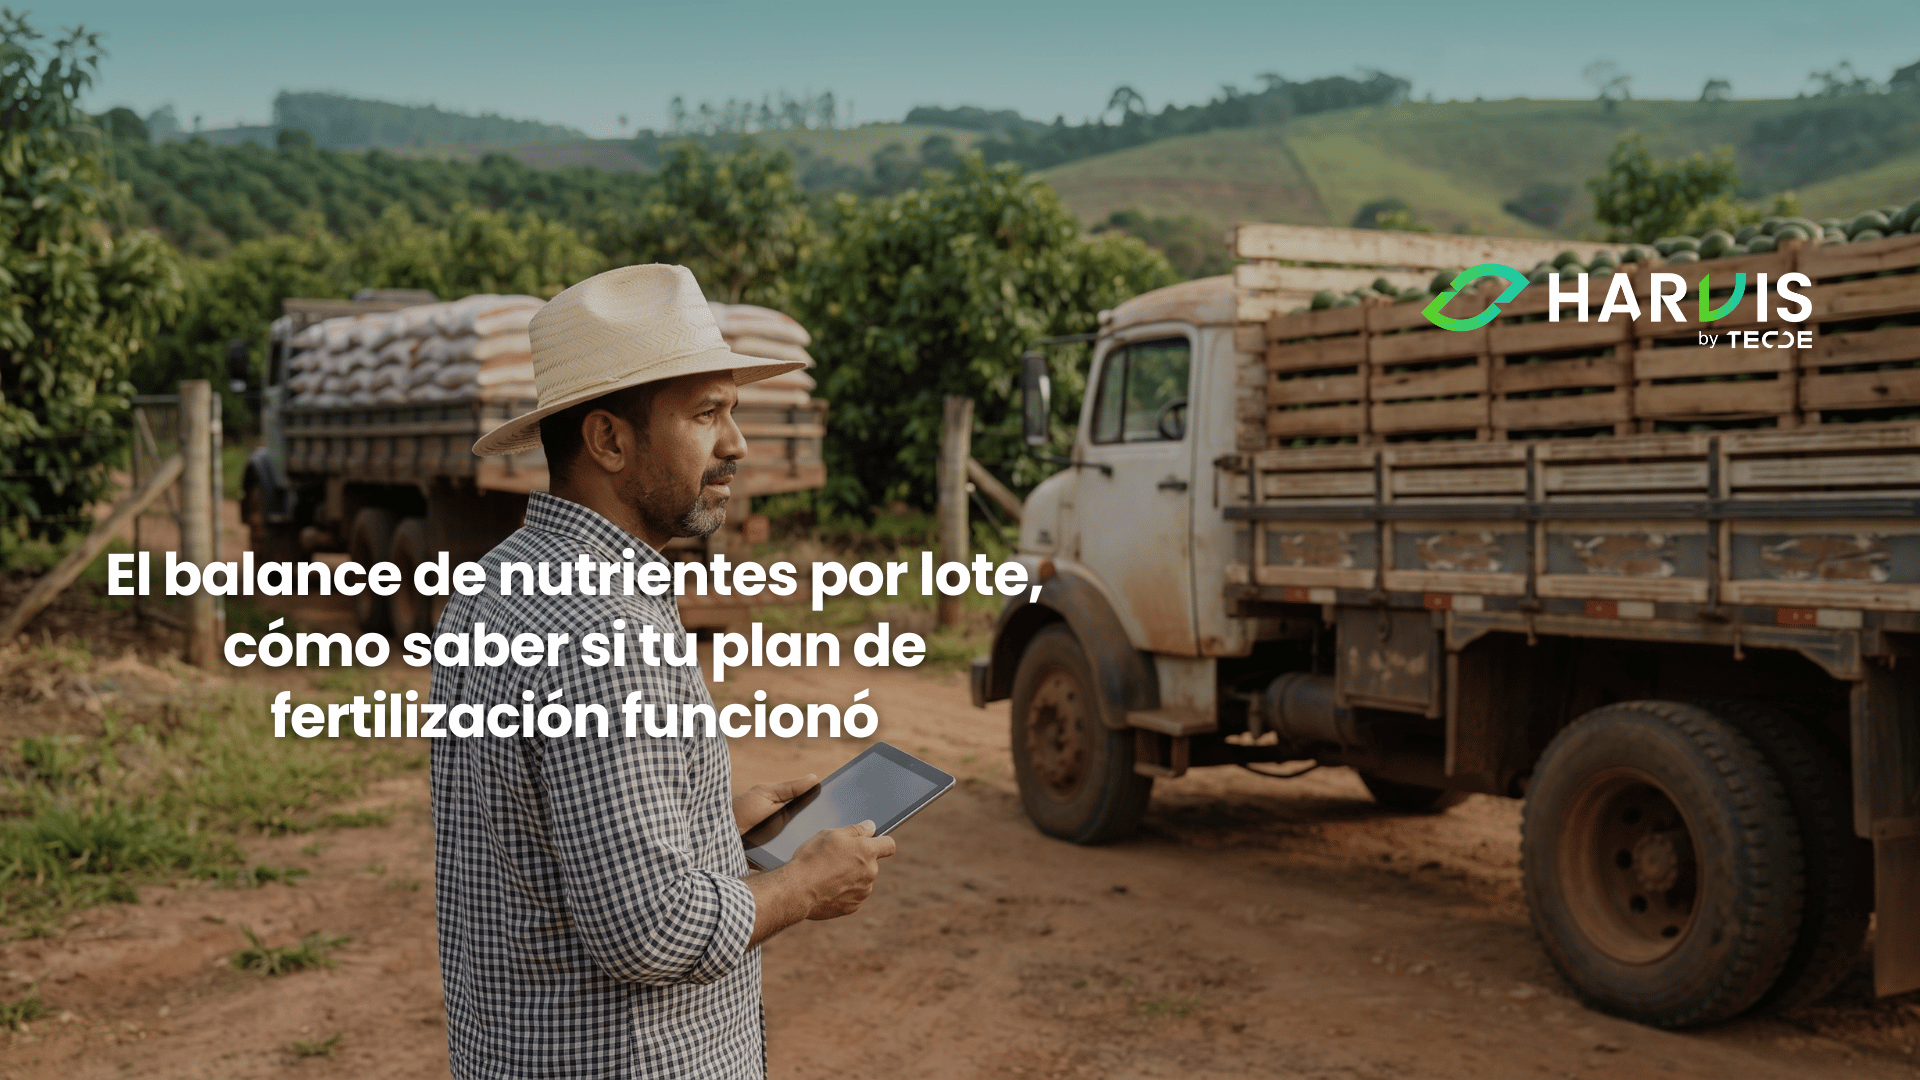
In the farm office, there are two documents that describe the same lot and that have never been found. One is the invoice folder, with the bags purchased, dates, and prices. The other is the scale notebook, with the kilos that came out in each harvest. The first indicates how much nitrogen, phosphorus, and potassium entered the lot during the year. The second indicates how much left in the truck. Subtracting the second from the first takes twenty minutes and produces the most informative number of the entire campaign, and almost no farm has it calculated.
The nutrient balance is the difference between the inputs and outputs of a system, with a surplus when the result is positive and a deficit when it is negative, and the efficiency of use is the output expressed as a percentage of the input. The global bases that have tracked this indicator since 1961 show that the global efficiency of nitrogen use dropped from 59 percent in 1961 to 55 percent in 2020, while nitrogen surpluses per hectare increased by 320 percent during the same period. In simple terms, the world has been applying more and recovering a smaller fraction for sixty years.
This season measured the leaf to know what the plant absorbed, the week to know when it was hungry, aluminum saturation to know if the root could seek, and the source to know how much arrived alive in the soil. The four are input diagnostics, made before or during the campaign. The balance is the only one done at the end, with papers that already exist, and it indicates whether all the previous efforts were effective.
Two Columns That Never Add Up Together
The account has two sides, and the most common mistake is believing that the difficult side is the inputs. It's the other way around. The inputs are invoiced, have dates and responsible parties, and all you have to do is convert bags into nutrient units, multiplying the kilos of product by the percentage declared on the label. A 50-kilo bag of urea at 46 percent provides 23 kilos of nitrogen, and that conversion is all the arithmetic that the left side requires.
The output side is the one that almost no one has, because it requires knowing how much nutrient each ton of product leaving the farm carries. For Hass, the work that measured the composition of the harvested fruit in Colombian commercial orchards reports around 3.3 kilos of nitrogen, 0.48 of phosphorus, and 4.0 of potassium per ton of fruit, with 0.56 of sulfur, 0.51 of magnesium, and 0.31 of calcium. Other estimates for the same crop hover around 2.5 of nitrogen, 0.6 of phosphorus, and 4.5 of potassium per ton, and that range already tells you something important: the order among nutrients is stable even if the exact figure is not. In Hass, more potassium comes out than nitrogen for every ton shipped, and fertilization plans are rarely built that way.
With both sides on the table, the important number appears. The citrus nutrition guides from a university extension explicitly perform that subtraction for an adult orchard, and the result is the cleanest example that exists. A lot that receives the equivalent of 224 kilos of nitrogen per hectare per year and harvests a production that takes about 81 kilos leaves 143 kilos per hectare unexplained after the harvest. It is not a calculation error. It is a balance with a known direction, and a good part of it has a destination, because in controlled leaching studies, about 40 percent of the nitrogen applied to the soil is not recovered even when water is applied immediately after application. Keep that balance of 143 kilos, because later we will see what part of it is loss and what part is tree.
Inputs You Don't Count, and One of Them Comes from Your Own Beneficiary
The surplus inflates when you count too much on the left side, and it becomes misleading when you count too little. Both things happen.
You count too little when you only register synthetic fertilizer. Global series show that synthetic fertilizer went from contributing 22 percent of the nitrogen entering crops in 1961 to 58 percent in 2020, while manure dropped from about 38 percent to 14. Just because it has lost relative weight doesn't mean it has disappeared from your lot. Chicken manure, compost, lime that brings calcium and magnesium, pruning residues left on the ground, and biological fixation from shade legumes are real inputs, and leaving them out of the left column produces a balance that seems adjusted when in reality it is surplus.
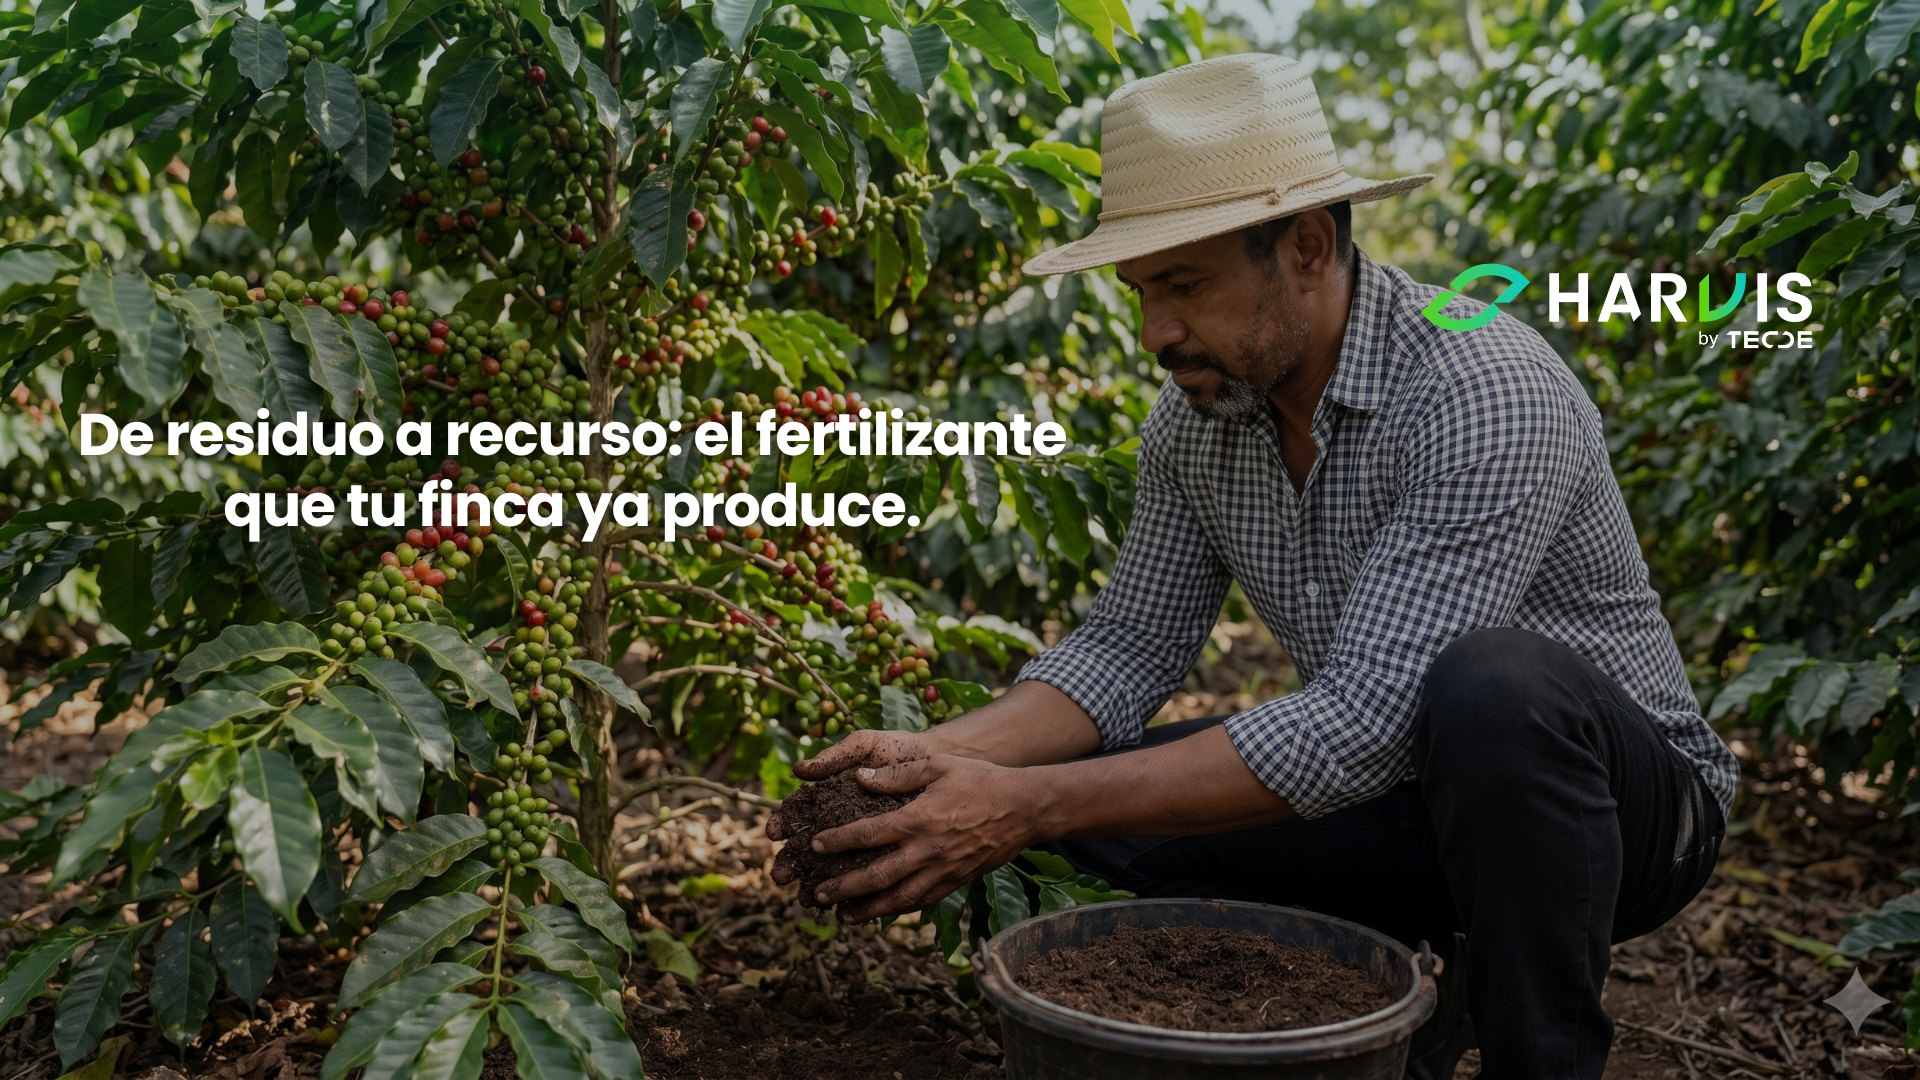
The largest unaccounted input on a coffee farm comes from the beneficiary. The pulp concentrates most of the potassium from the fruit, so each ton processed leaves a concentrated flow of an expensive nutrient in the yard, and that flow returns to the lot or is lost depending on what you decide to do with it. If you compost it and return it, it is an input you must note in the left column and deduct from the purchase; if you don't, it is an additional output you must add to the right. In both situations, the balance changes, and in neither does it appear on the invoice.
As we already addressed in our blog From Waste to Resource: The Fertilizer Your Farm Already Produces, which you can read here, a good part of what you buy is already being produced by your own system. The balance per lot is the tool that converts that statement into a number because it forces you to note as input what is currently treated as waste.
Was There a Surplus or a Deficit? How to Read the Balance of a Lot
A balance is read in three categories, and each one requires a different decision.
A large surplus is the most common situation in technified farms and means you are buying nutrients that do not end up in the product. Part of that surplus is lost through volatilization in the days following application, part is leached down with rain, and part remains fixed in forms that the root cannot reach. The European panel of nitrogen experts, which built the most used reference framework for this indicator, proposes a surplus ceiling of around 80 kilos of nitrogen per hectare per year. The 143 kilos from the citrus orchard in the example are well above that ceiling, and that is what turns an abstract number into a purchasing signal.
A deficit is less frequent and much more serious because it does not hurt in the campaign in which it occurs. If you take out more than you put in, the difference comes from the soil, and the soil has reserves that take years to deplete and decades to replenish. That is why the global bases warn that an efficiency of use above one hundred percent needs careful interpretation, as it may indicate an undesirable depletion of soil reserves or a deliberate consumption of accumulated surpluses. An old lot that has been yielding for years with little fertilization is not an efficient lot; it is a lot that is spending its capital.
The third case is the reasonably adjusted balance, and there the decision is to change nothing and repeat the measurement. The same European framework sets the desirable efficiency range between 50 and 90 percent, with a production floor so that the account is not simply fulfilled by producing little. Below 50, you are losing; above 90, you are mining; and in the middle, you are managing.
Knowing if the Lot Closed with a Surplus or a Deficit
Can you say today, for each lot, how many units of nitrogen, phosphorus, and potassium entered the campaign, how many left in the harvest, and what the balance was? In most farms, both halves of that account exist but live separately, purchases in accounting and kilos in the steward's notebook, and no one crosses them because crossing them by hand for twelve lots is a multi-day job. Harvis helps you record purchases and applications per lot converted to nutrient units, to add the harvest of each lot with its date, to calculate the balance and efficiency of use without you having to do the conversion by hand, and to compare the series between campaigns to see which lots are improving and which are living off the soil's reserves. Contact us, and we will set it up based on the lots and tasks you already have recorded.

Two Numbers That Summarize the Year
From the balance come two indicators that fit in one line each and serve to compare lots and campaigns without discussing agronomy.
The first is the partial productivity of the factor, which is simply the kilos harvested divided by the kilos of nutrient applied. If a coffee lot produces 1,500 kilos of green coffee per hectare and received 250 kilos of nitrogen, its partial productivity is 6 kilos of coffee for each kilo of nitrogen. It is a rough number; it does not distinguish between what the fertilizer contributed and what the soil contributed, and for that reason, it is the most honest to follow a trend over several years in the same lot.
The second is the partial nutrient balance, which is the output divided by the input. With an extraction of around 40 kilos of nitrogen per ton of green coffee, that same lot took about 60 kilos and received 250, so its partial balance is 24 percent. In the citrus orchard from the previous example, the account gives 36 percent, and in a Hass lot of 20 tons per hectare that receives 200 kilos of nitrogen, the fruit extraction is around 66 kilos, and the indicator stands at 33 percent.
These percentages seem very low against the desirable range of 50 to 90, and before concluding that all fruit farms on the continent are wasting nitrogen, it is worth understanding why. In a perennial crop, the fruit is not the only output or destination. A fraction of the nitrogen you apply remains building wood, leaves, and roots that do not leave the farm, and another fraction returns to the ground in leaf litter and recycles internally. The indicator does not distinguish between what was lost and what stayed within the system, and that ambiguity is precisely what the number we kept above resolves.
There is a practical way to resolve it without instruments. The tree accumulates biomass quickly while it grows and much more slowly when it is in full production, so in an adult and stable lot, the fraction of the balance that remains building structure is small, and the one that is lost is large. In a young lot, it is the other way around. The same figure of 143 kilos per hectare means investment in a three-year-old lot and loss in a fifteen-year-old one, and what turns the ambiguity into information is the age of the lot, not an additional analysis.
Why a One-Year Balance Is Not Useful for Decision-Making
The first limit is the one we just named, and it is worth writing it down as a warning for use. The partial balance does not measure losses; it measures the difference between two quantities, and in a perennial crop, that difference includes the growth of the tree itself. Using the indicator to calculate how much nitrogen was lost is to overestimate the loss, sometimes by a lot.
The second limit is that the soil enters and exits the account without warning. The authors of the global balance database explicitly warn that changes in soil nutrient reserves are hidden within the estimated surplus or deficit, and that separating them is difficult due to the dynamic nature of soil system processes. In farm terms, a year with a lot of mineralization of organic matter can give a balance that seems efficient without you having done anything different.
The third limit is the variance between campaigns, and it is what makes a single year almost useless. In fruit trees with alternating harvests, the same lot with the same fertilization plan produces a lot one year and little the next, and since production is in the numerator of both indicators, the result moves without the fertilization having changed. A one-year balance describes one year. A series of three begins to describe management.
The fourth point is about the transfer of figures. The ranges of 50 to 90 percent efficiency and the ceiling of 80 kilos of surplus were built thinking about temperate climate annual cropping systems, and their own authors point out that the reference values are specific to the system and location. What transfers is the structure of the account, inputs minus outputs per lot, and the series over time, not the threshold table.
A Lot, the Invoices of One Year, and What Came Out in the Truck
The exercise does not require buying anything or changing management, and it can be done with a campaign that has already ended. Choose a lot with clear boundaries and measured area, because the entire exercise is expressed per hectare, and a poorly estimated area ruins both indicators before starting.
Gather the input invoices from the last twelve months and separate those corresponding to that lot. For each product, note the kilos applied and the grade on the label, and multiply to obtain the units of nitrogen, phosphorus, and potassium. Sum separately the inputs that do not have invoices, chicken manure, compost, returned pulp, and lime, estimating their content with the material analysis or with the reference value provided by the laboratory. That is your left column.
Then look for the harvest records of the same lot and sum the kilos that came out, in the unit in which you sell them. Multiply by the extraction coefficient of your crop, and you will have the right column. If you do not have the coefficient at hand, use the published range and work with the midpoint, which for the purpose of this exercise is sufficient.
Subtract, divide, and write four numbers on a single sheet: the balance per hectare for each nutrient, the partial productivity of the factor, the partial balance, and the age of the lot. That sheet already tells you more than any general recommendation because it is made with your area, your purchase, and your harvest.
Repeat it with a second lot that you consider different, the one that always yields less or the one that is on another slope. The comparison between two lots of the same farm in the same campaign neutralizes the climate, which is the variable that most muddles this type of account, and usually shows differences that neither of the two soil analyses had anticipated.
The Account That No Supplier Will Do for You
It is worth mentioning the discomfort of this season's closing. The balance is not purchased, has no brand, does not require equipment or a technical visit, and the input it requires is two documents that your farm already generates by accounting and operational obligation. That is why it does not appear in any commercial proposal, and that is why a trial in Hass that built the fertilization plan based on the extraction of the fruit and the nutritional state of the tree ended up finding that the producer's usual plan used excessive doses of nitrogen, phosphorus, potassium, and calcium, with additional imbalance in phosphorus, calcium, and micronutrients, and that the corrected plan increased production by 20 kilos per tree in the second year and increased the proportion of large caliber fruit. Applying less and producing more is not a paradox; it is what happens when the dose comes from a subtraction instead of from a habit.
What you can do starting Monday fits into five decisions. Convert the invoices of the year for a single lot into nutrient units, because while the purchase is noted in bags, no balance is possible. Add the harvest of that same lot and multiply it by the extraction coefficient of your crop, since without the right side, the account does not exist. Note the inputs that do not have invoices, chicken manure, lime, and especially the pulp you return, as they are the ones that turn an apparent surplus into a real one. Calculate the two indicators and write them next to the age of the lot, because the same balance means investment in a young lot and loss in an adult one. And keep the sheet to compare it next year, as that is the only thing that turns an account into a series. The producer who does this subtraction three campaigns in a row knows which of his lots is buying nutrients that he does not harvest and which is living off the soil's reserves; the one who does not do it will continue adjusting the dose based on the price of the bag and what the neighbor says, and will continue not knowing which of the two things is happening to him.
Do you want to have the purchases, applications, and harvest of each lot in the same account, with the balance and efficiency of use calculated campaign after campaign? Contact us via WhatsApp or schedule a demo, and we will show you how Harvis converts your invoices and scale records into the series you need to decide next year's purchase.
Consulted References
- Ludemann, C. I. et al. (2024). A global FAOSTAT reference database of cropland nutrient budgets and nutrient use efficiency (1961–2020), nitrogen, phosphorus and potassium. Earth System Science Data, 16, 525–541. https://doi.org/10.5194/essd-16-525-2024
- Composition and removal of nutrients by the harvested fruit of avocado cv. Hass in Antioquia. Revista Facultad Nacional de Agronomía Medellín. https://revistas.unal.edu.co/index.php/refame/article/view/71929
- University of California Agriculture and Natural Resources. Avocado Fertilization, Book 2, Chapter 2. https://ucanr.edu/sites/default/files/2016-07/121293.pdf
- UF/IFAS Extension. 2025–2026 Florida Citrus Production Guide, Nutrition Management for Citrus Trees, CMG13/CG091. https://edis.ifas.ufl.edu/cg091
- EU Nitrogen Expert Panel. (2015). Nitrogen Use Efficiency (NUE), an indicator for the utilization of nitrogen in agriculture and food systems. Wageningen University. https://www.eunep.com/wp-content/uploads/2023/12/Report-NUE-Indicator-Nitrogen-Expert-Panel-18-12-2015.pdf
- Nutrient Use Efficiency, Measurement and Management. University of Nebraska, Agronomy and Horticulture Faculty Publications. https://digitalcommons.unl.edu/agronomyfacpub/1442/
- Rebolledo-Roa, A. and Burbano-Diaz, R. A. (2023). Nutrient Balance in Hass Avocado Trees as a Tool to Optimize Crop Fertilization Management. Agronomy, MDPI, 13(8), 1956. https://doi.org/10.3390/agronomy13081956
- Lassaletta, L., Billen, G., Grizzetti, B., Anglade, J. and Garnier, J. (2014). 50 year trends in nitrogen use efficiency of world cropping systems, the relationship between yield and nitrogen input to cropland. Environmental Research Letters, 9, 105011. https://doi.org/10.1088/1748-9326/9/10/105011
- Quan, Z., Zhang, X., Fang, Y. and Davidson, E. A. (2021). Different quantification approaches for nitrogen use efficiency lead to divergent estimates with varying advantages. Nature Food, 2, 241–245. https://doi.org/10.1038/s43016-021-00263-3
- Global mean nitrogen recovery efficiency in croplands can be enhanced by optimal nutrient, crop and soil management practices. PMC. https://pmc.ncbi.nlm.nih.gov/articles/PMC10505174/
- Effect of contrasting nitrogen sources on nutrient use efficiency indicators. (2025). Frontiers in Agronomy. https://doi.org/10.3389/fagro.2025.1602166
- University of California, Division of Agriculture and Natural Resources. Nitrogen Management in Citrus and Avocado. https://ciwr.ucanr.edu/files/283980.pdf
- California Department of Food and Agriculture, FREP. California Fertilization Guidelines, Avocado. https://www.cdfa.ca.gov/is/ffldrs/frep/FertilizationGuidelines/Avocado.html
- Agronomic Management, Socioeconomic Factors, and Carbon and Nitrogen Pools in Avocado–Coffee Systems. (2025). Resources, MDPI, 14(3), 35. https://doi.org/10.3390/resources14030035
- UF/IFAS Extension. Increasing Efficiency and Reducing Costs of Citrus Nutritional Programs, SL222/SS442. https://edis.ifas.ufl.edu/ss442
- Oregon State University Extension Service. Nutrient Management for Blueberries in Oregon, EM 8918. https://extension.oregonstate.edu/catalog/pub/em-8918-nutrient-management-blueberries-oregon
- Food and Agriculture Organization of the United Nations. Arabica Coffee Manual, chapter on nutrition and fertilization. https://www.fao.org/4/ae939e/ae939e06.htm